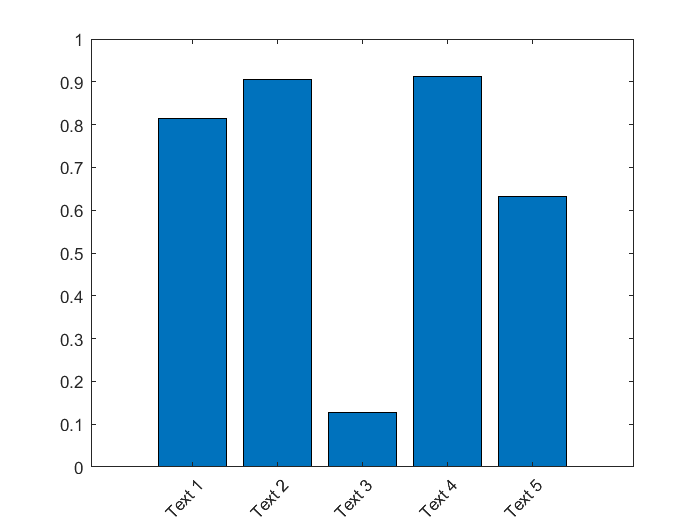
In this blog, I list some skills for figure ploting in Matlab, in case that I need to plot similar figures someday and I forget the commands.
- A bar figure with rotated text x label
1
2
3
4
5
y = rand(1,5);
figure,
bar(y);
x_test = {'Text 1','Text 2','Text 3','Text 4','Text 5'};
set(gca,'XTickLabel',x_test,'XTickLabelRotation',46);

2.


近期评论