
The utility function expresses personal preferences
by mapping from dollars spent into relative happiness.
It can help you say ‘meh’ by precisely
identifying the locus of events for which you are equally happy
(or unhappy) about.
A previous post about the Bellman equation
used a (-1/c) utility function.
That was unrealistic because it doesn’t take into account
the fact that there is actually a minimum set of costs
that everyone faces.
For example, the federal poverty level
for an individual was $12,140 last year, while that for a
family of 4 was $25,100.
This article develops a better utility function
with a minimum spending preference.
The central idea is to use the 'maximum term approximation' from
statistical mechanics:
$$ max(x(t),y(t)) approx log( e^{x(t)} + e^{y(t)} ) $$
.
In a molecular context, this equation could describe
the dependence of the free energy on temperature, (t),
during a phase change.
Then, (x) and (y) would both be concave
functions giving the free energy of one particular phase.
At the boiling point, the operative function switches
over from the liquid to the gas curve.
This equation also appears in a Bayesian context, where
the cross-over represents an abrupt change in
opinion between two alternative hypotheses.
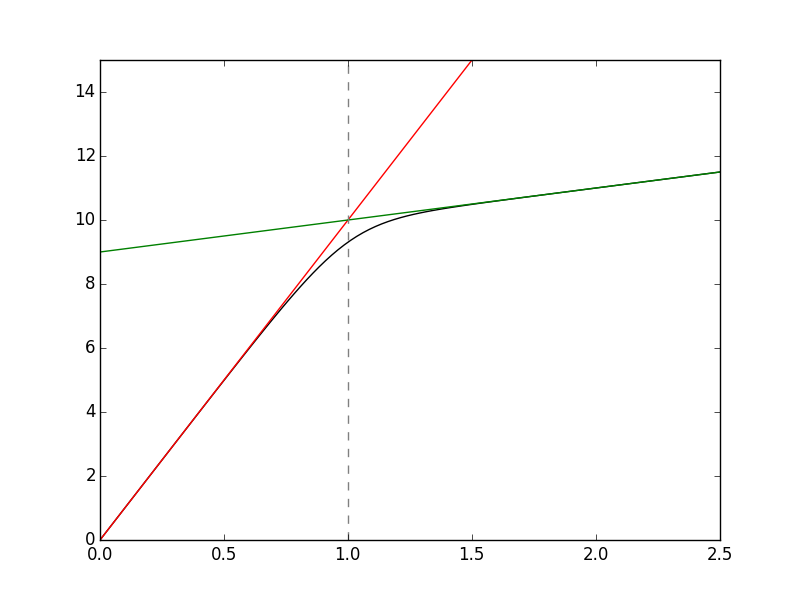
In our case, let's use two lines, crossing at ( t = 1)
and shifted so that (x(0) = 0):
$$ x(t) = alpha t $$
$$ y(t) = t + alpha - 1 $$
Now, we can think about replacing the ‘consumption’ argument
to the utility function, (U(C)), with:
$$
tilde C(t = C/C_0) = log(1 + e^{-y(0)}) - log(e^{-x(t)} + e^{-y(t)})
$$
This inverts the max function to get the min function,
and shifts the result so that ( tilde C(0) = 0 ).
The resulting (tilde C(t)) looks like we’d expect (black line):
For the general utility function which grows like
the (1 - rho) power of (C),
we add a scale and shift so that the function
crosses zero at ( C_0 ),
and has a slope of 1 there.
$$
U(tilde C) = frac{C_0}{1-rho}
({tilde C(C/C_0)}^{1-rho} - {tilde C(1)}^{1-rho})
$$
Of course, ( rho = 1) is a special case.
I’m rather happy with the result, shown for (rho = 1, alpha = 10):
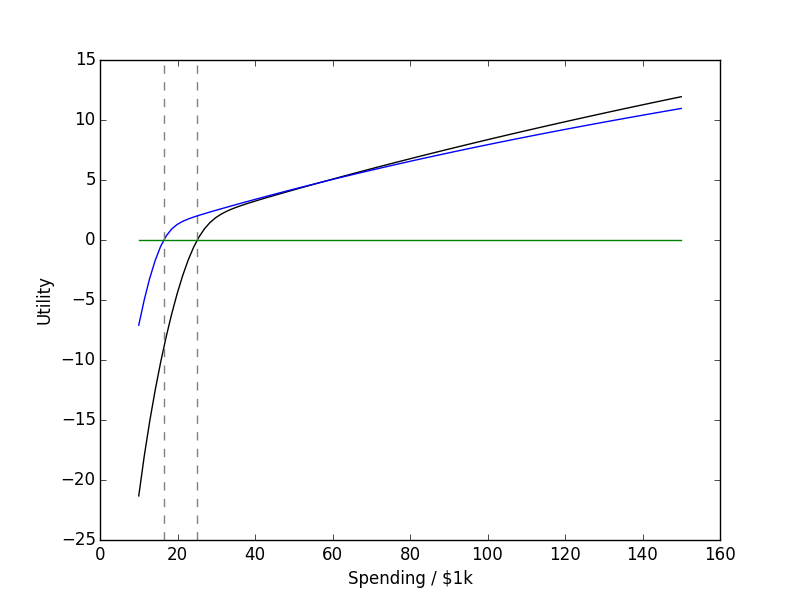
The two lines are the final utility as a
function of dollars spent when your family size is
two (blue line) or four (black line).
The code is below:
from numpy import *
import pylab as plt

# constants
rho = 1
C0fac = 10.0
Cmin = log(1.0 + exp(1.0-C0fac))
C0p  = C0fac + Cmin - log(2.0) # zero level
# Assume C0 == 1, since we scale so that dU/dC = 1 at C = C0
# Argument to the utility function is:
# C' = min(C0fac*C, C + C0fac - 1)
# two lines cross at C = 1.0
def util(Cscale, C, n): # for rho != 1
    C = C/Cscale
    C1 = C + C0fac-1 # min
    C2 = C1 - C0fac*C     # diff. (< 0)
    if isinstance(C, ndarray):
        w1 = where(C < 1.0)
        C1[w1] = C0fac*C
        C2[w1] *= -1.0
    elif C < 1.0:
        C1 = C0fac*C
        C2 *= -1.0

    Z  = 1.0/(1.0 + exp((C0fac-1)*(C-1.0)))
    Cp = C1 + Cmin - log(1.0 + exp(C2)) # -log(Z) = x - log(1 + e^{x-y})
    #return Cp # min function

    if n == 0:
        if rho == 1:
            return Cscale*(log(Cp) - log(C0p))
        return (Cp**(1.0-rho) - C0p**(1.0-rho)) * (Cscale/(1.0-rho))
    elif n == 1:
        r = Cp**(-rho)
        return r*(1.0 + (C0fac-1.0)*Z)
    elif n == 2:
        rp = Cp**(-rho)
        rpp = -rho * Cp**(-rho-1.0)
        return (rpp*(1.0 + (C0fac-1.0)*Z)**2 -
                 rp*Z*(1.0-Z)*(C0fac-1.0)**2 ) / Cscale
    return None
Note how C1 is always the minimum of the two
lines, and how C2 stores their difference.
This ensures numerical stability, since it isolates
the largest contribution (the straight line) and all the
log/exp stuff is just a perturbation that goes away
far from crossover.
I’ve seen codes from respected folks in statistical mechanics
that are sloppy, and miss that.
In the next article, I’ll provide the constrained
optimization code needed to solve asset allocation problems.
It’s interesting to philosophize a bit at this point.
Since the curve seems to say that spending $58,000 on
a family of 4 provides a reward of +5 as opposed
to cutting back expenses to $19,000 (reward of -5).
This makes a great case for charity if we value the
spending of others as much as ourselves.
Economic data says average charity donations are
around $2,000 per year, while median incomes are $54,000.
Would donations be higher if we knew
the people we could be helping well enough to
value their spending?


近期评论