
Abstract: Logistic Regression was used in the biological sciences in early twentieth century. It was then used in many social science applications. Logistic Regression is used when the dependent variable(target) is categorical.
1. Introduction
I have been doing some machine learning and deep learning work for a while, and it’s been a long time since I wrote my last post, I guess it’s time to start a new series (开个新坑) to introduce some classic and famous algorithms in this area. I hope keeping notes can also deepen my understanding of machine learning and deep learning.
Firstly, let’s take a look at the term of regression. We may get to know regression back to high school or college calculus courses.
Among machine learning models, there’re basically three types of regression models.
linear Regression:
- Simple Linear Regression(One Variable):
y = b0 + b1x- Multuple Linear Regression(Multiple Variables):
y = b0 + b1x1 + … + bnxn- Polynomial Linear regression
y = b0 + b1x1 + b2x12 + … + bnx1n
Image on the left is the simple linear regression model, and the right one is the Polynomial Regression model. linear regression is a linear approach to modelling the relationship between a scalar response (or dependent variable) and one or more explanatory variables (or independent variables). The case of one explanatory variable is called simple linear regression. For more than one explanatory variable, the process is called multiple linear regression. Polynomial regression fits a nonlinear relationship between the value of x and the corresponding conditional mean of y, denoted E(y|x), and has been used to describe nonlinear phenomena such as the growth rate of tissues, and the distribution of carbon isotopes in lake sediments. (Wikipedia)
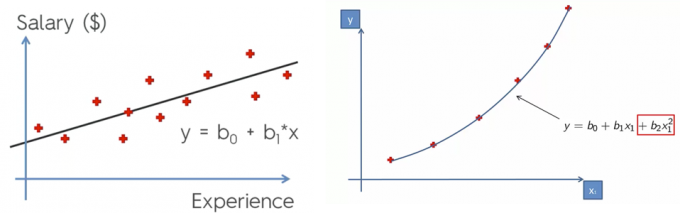
We’ve got the example of salary versus experience. If you have more experience in such a field, you may be paid more. For the linear regression model, it puts a line through our data and that line is modeling our observations. So we can basically forecast things and compare our actual preservations to our model.
However, consider a scenario where we need to classify whether an email is a spam or not. If we use linear regression for this problem, there is a need for setting up a threshold based on which classification can be done. Say if the actual class is malignant, predicted continuous value 0.4 and the threshold value is 0.5, the data point will be classified as not malignant which can lead to serious consequence in real time.
From this example, it can be inferred that linear regression is not suitable for the classification problem. Linear regression is unbounded, and this brings logistic regression into a picture. Their value strictly ranges from 0 to 1.
2. Logistic Regression
As we mentioned in the abstract, Logistic Regression is used when the dependent variable(target) is categorical.
2.1 Model Introduction
The goal of logistic regression is to find the best fitting (yet biologically reasonable) model to describe the relationship between the dichotomous characteristic of interest (dependent variable = response or outcome variable) and a set of independent (predictor or explanatory) variables. Logistic regression generates the coefficients (and its standard errors and significance levels) of a formula to predict a logit transformation of the probability of presence of the characteristic of interest:
logit(p) = b0 + b1X1 + b2X2 + … + bkXk
where p is the probability of presence of the characteristic of interest. The logit transformation is defined as the logged odds:
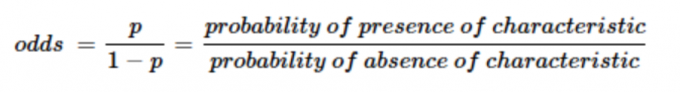
and,
logit(p) = ln(p/1-p)
Rather than choosing parameters that minimize the sum of squared errors (like in ordinary regression), estimation in logistic regression chooses parameters that maximize the likelihood of observing the sample values.
2.2 Types of Logistic regression
- Binary Logistic Regression
The categorical response has only two 2 possible outcomes. Example: Spam or Not- Multinomial Logistic Regression
Three or more categories without ordering. Example: Predicting which food is preferred more (Veg, Non-Veg, Vegan)- Ordinal Logistic Regression
Three or more categories with ordering. Example: Movie rating from 1 to 5
2.3 Decision Boundary
To predict which class a data belongs, a threshold can be set. Based upon this threshold, the obtained estimated probability is classified into classes.
Say, if predicted_value ≥ 0.5, then classify email as spam else as not spam.
Decision boundary can be linear or non-linear. Polynomial order can be increased to get complex decision boundary.


近期评论