
What is Weka?
Weka is a data mining software suite developed by Waikato university in New Zealand. Weka is an abbreviation, it stands for Waikato Environment for Knowledge Analysis.
We have got Python, R in data mining and they have been standard tool in the industry. Then why Weka?
Because Weka is so handy to explore data and try different models without even writing single line of code. Yet it also offers flexbility to integrate with Python, R and even distributed computing architecture, for example Spark to do streaming computing, which is awesome. I will demonstrate those capabilities in my future blogs.
Weka explorer
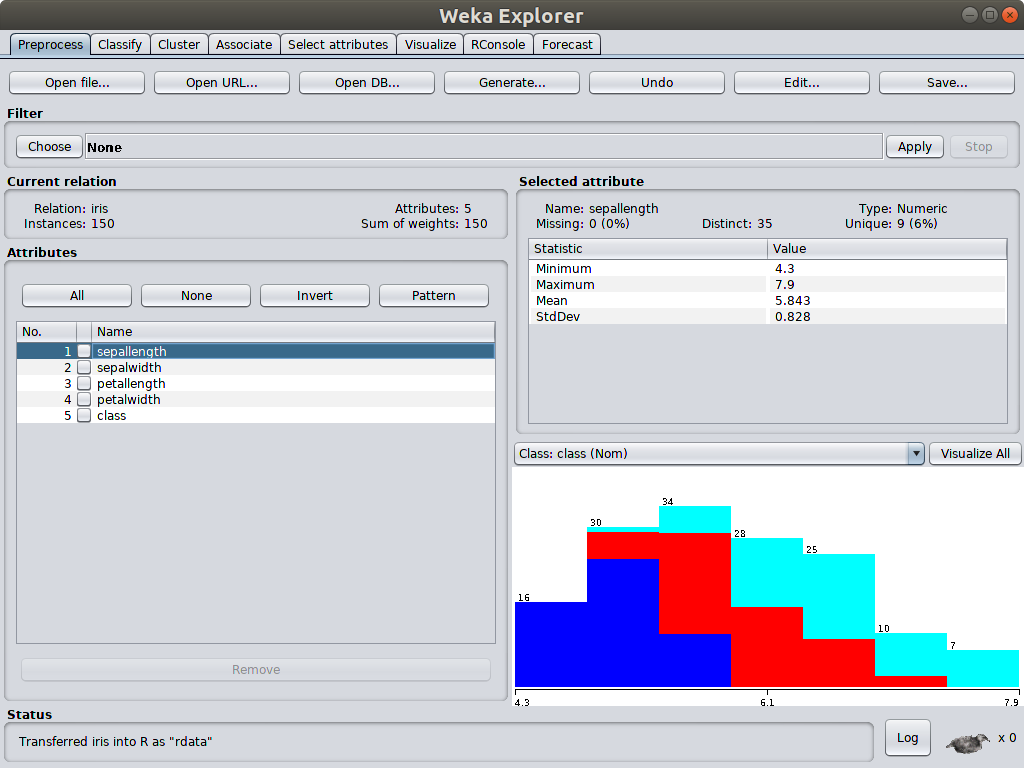
Weka explorer is the most used tool in Weka software suite. In the Proprocess panel, it shows the common statistics of dataset by default, such as minimal, maximum, mean and standard deviation of selected attribute.This immediately offers some insights of data. It is easy to spot whether the minimal, maximum or mean value is reasonable or not if data analyzer has domain knowledge.
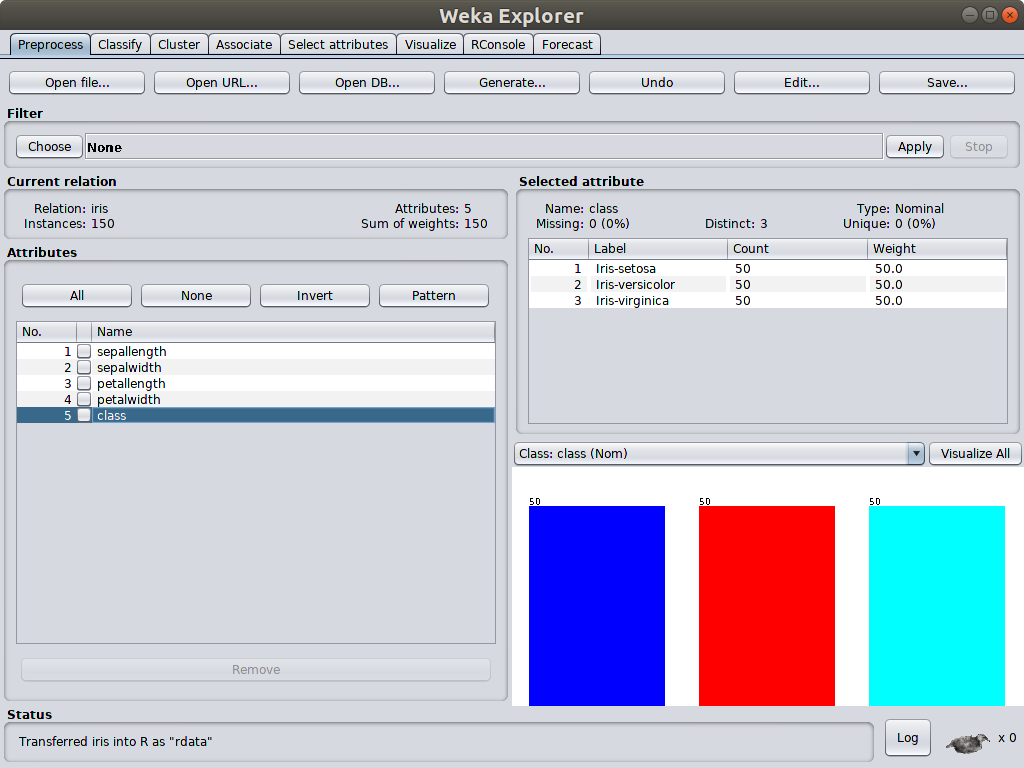
What is even more useful is the distribution graph. For example, to answer the question “Does the class Iris-setosa tend to have high or low values of sepallength” from the classic iris dataset, what user needs to do is to hover the mouse over each colored bar when class attribute is selected as shown in the picture above, then user can see Iris-setosa is colored in blue. Select the sepallength attibute, user can see the blue is distributed towards left, which has low values. Therefore, class Iris-setosa tend to have low values of sepallength.
Combining common statistic values with distribution graph, user can quickly gain a sense of data and see whether the data is reasonable or not. This is very important for data mining in the initial phase and Weka does a good job offering this capability.


近期评论