k means, kernel k means and hierarchical clustering

In this post, K means algorithm, Kernel K means and Hierarchical Clustering were implemented by Python.

1
2
3
4
import numpy as np
from matplotlib import cm
import matplotlib.pyplot as plt
%matplotlib inline

Data Generator

Gaussian Data Generator

1
2
3
4
5
6
7
8
9
10
def ():
nPerClass = 200
mu0 = np.array([-1, -2])
mu1 = np.array([1, 1])
Sigma0 = np.array([[1, 0.8],[0.8, 1]])*0.5
Sigma1 = np.array([[1, 0.8], [0.8, 1]])*0.6
X1 = np.random.multivariate_normal(mu0, Sigma0, nPerClass)
X2 = np.random.multivariate_normal(mu1, Sigma1, nPerClass)
X_out = np.concatenate((X1, X2))
return X_out

Ring Data Generator

1
2
3
4
5
6
7
8
9
10
11
def generateRingData():
nPerClass = 50;
rMax = 10;
rMin = 2;
X = np.random.rand(nPerClass*20, 2)*rMax*2 - rMax
keepers = np.logical_and(np.linalg.norm(X, axis=1)>2, np.linalg.norm(X, axis=1)<4)
X1 = X[keepers, :]
keepers = np.logical_and(np.linalg.norm(X, axis=1)>8, np.linalg.norm(X, axis=1)<10)
X2 = X[keepers, :]
X_out = np.concatenate((X1, X2))
return X_out

Spiral Data Generator

1
2
3
4
5
6
7
8
9
10
11
12
13
14
15
16
17
18
19
20
21
22
23
24
25
26
27
def wrapTopi(x):
xwrap=np.remainder(x, 2*np.pi)
mask = np.abs(xwrap)>np.pi
xwrap[mask] -= 2*np.pi * np.sign(xwrap[mask])
return xwrap

def generateSpiralData():
nPerClass = 100;
rMax = 10;
rMin = 2;
X = np.random.rand(nPerClass*20, 2)*rMax*2 - rMax
r = np.sqrt(np.sum(X**2, axis=1))
theta = np.arctan2(X[:,1], X[:,0])
a = 1;
b = 1;
thetaHat = (r-a)/b;
keepers = np.logical_and(np.abs(theta - wrapTopi(thetaHat))<0.7, r < rMax, r > rMin)
X1 = X[keepers,:]
a = 4;
b = 1;
thetaHat = (r-a)/b;
keepers = np.logical_and(np.abs(theta - wrapTopi(thetaHat))<0.7, r < rMax, r > rMin)
X2 = X[keepers,:]
X_out = np.concatenate((X1, X2))
point_filter = np.linalg.norm(X_out, axis=1)>rMin
X_out = X_out[point_filter]
return X_out
1
2
3
4
5
def Standardized(data):
feature_mean = np.mean(data, axis=0)
feature_std = np.std(data, axis=0)
data = (data - feature_mean)/feature_std
return data
1
2
3
data1 = generateGaussianData()
data2 = generateRingData()
data3 = generateSpiralData()
1
2
3
data1 = Standardized(data1)
data2 = Standardized(data2)
data3 = Standardized(data3)
1
2
3
4
5
6
7
8
9
10
11
12
13
14
15
16
17
f, (ax1, ax2, ax3) = plt.subplots(1, 3,figsize=(13,4))
ax1.grid(True)
x = data1[:,0].tolist()
y = data1[:,1].tolist()
ax1.scatter(x, y, marker='o', linewidths=0.001)

ax2.grid(True)
x = data2[:,0].tolist()
y = data2[:,1].tolist()
ax2.scatter(x, y, marker='o', linewidths=0.001)

ax3.grid(True)
x = data3[:,0].tolist()
y = data3[:,1].tolist()
ax3.scatter(x, y, marker='o', linewidths=0.001)

plt.show()

png

K means

1
2
3
4
5
6
7
8
9
10
11
12
13
14
15
16
17
18
19
20
21
22
23
24
25
26
def EuclideanDistance(p1, p2):
return np.linalg.norm(p1-p2)
def Kmeans(data, k, epoch):
n, p = data.shape
c_idx = np.random.choice(n, k, replace=False)
centers = data[c_idx]
clusters = {}
epoch_count = epoch
diff_sum = np.linalg.norm(centers)
while diff_sum > 0.0000001 and epoch_count > 0:

epoch_count -= 1
for i in range(k):
clusters['cluster_'+str(i)] = []
for i in range(n):
distances = np.zeros(k)
for j in range(k):
distances[j] = EuclideanDistance(data[i], centers[j])
min_idx = np.argmin(distances)
clusters['cluster_'+str(min_idx)].append(i)
diff_sum = 0
for j in range(k):
new_cent = np.mean(data[clusters['cluster_'+str(j)]], axis=0)
diff_sum += np.linalg.norm(centers[j] - new_cent)
centers[j] = new_cent ## update center
return centers, clusters
1
2
3
centers1, clusters1 = Kmeans(data1, 2, 10000)
centers2, clusters2 = Kmeans(data2, 2, 10000)
centers3, clusters3 = Kmeans(data3, 2, 10000)
1
2
3
4
5
6
7
8
9
10
11
12
13
14
15
16
17
18
19
20
21
22
23
24
25
26
27
28
29
30
31
32
33
34
35
plt.figure(figsize=(14,4))
plt.subplot(131)
plt.grid(True)
colors = cm.rainbow(np.linspace(0, 1, 2))
## Gaunssian
for j in range(2):
cent = centers1[j]
plt.scatter(cent[0], cent[1], marker='x', c=colors[j], s=100)
points = data1[clusters1['cluster_'+str(j)]]
plt.scatter(points[:, 0].tolist(), points[:,1].tolist(), c=colors[j], label='cls '+str(j))
plt.legend(loc='lower right')
plt.title('Gaussian Data:K means')
## Ring
plt.subplot(132)
plt.grid(True)
for j in range(2):
cent = centers2[j]
plt.scatter(cent[0], cent[1], marker='x', c=colors[j], s=100)
points = data2[clusters2['cluster_'+str(j)]]
plt.scatter(points[:, 0].tolist(), points[:,1].tolist(), c=colors[j], label='cls '+str(j))
plt.legend(loc='lower right')
plt.title('Ring data:K means')

## Spiral
plt.subplot(133)
plt.grid(True)
for j in range(2):
cent = centers3[j]
plt.scatter(cent[0], cent[1], marker='x', c=colors[j], s=100)
points = data3[clusters3['cluster_'+str(j)]]
plt.scatter(points[:, 0].tolist(), points[:,1].tolist(), c=colors[j], label='cls '+str(j))
plt.legend(loc='lower right')
plt.title('Spiral Data: K means')

plt.show()

png

Hierarchical Clustering

1
2
3
4
5
6
7
8
9
10
11
12
13
14
15
16
17
18
19
20
21
22
23
24
25
26
27
import heapq
class PriorityQueue:
def __init__(self):
self.heap = []
self.count = 0
def push(self, item, priority):
entry = (priority, item)
heapq.heappush(self.heap, entry)
self.count += 1
def pop(self):
(_, item) = heapq.heappop(self.heap)
self.count -= 1
return item
def isEmpty(self):
return len(self.heap) == 0

class Pair:
def __init__(self, cluster1, cluster2, dist):
self.cluster1 = cluster1 # a list
self.cluster2 = cluster2 # a list
self.pair_dist = dist
def __str__(self):
return "cluster1: " + str(self.cluster1) + "n" + "cluster2: " + str(self.cluster2) + "n" + "dist: " + str(self.pair_dist)

def computeMinDist(cluster1, cluster2, distmap):
sub_distmap = distmap[cluster1,:][:, cluster2]
return np.min(sub_distmap)
1
2
3
4
5
6
7
8
9
10
11
12
13
14
15
16
17
18
19
20
21
22
23
24
25
26
27
28
29
30
31
32
33
34
35
36
37
38
def HierarchicalCluster(data, k):
n, p = data.shape
clustersSet = []
## input all individual points as clusters
for i in range(n):
clustersSet.append([i])
## initial a heap to sort distance between pair of clusters
queue = PriorityQueue()
## compute a distance map
distmap = np.zeros((n, n))
for i in range(n-1):
for j in range(i+1, n):
dist = np.linalg.norm(data[i]- data[j])
distmap[i][j] = dist
distmap[j][i] = dist
## push all pair in the lowest level into a heap
for i in range(n-1):
for j in range(i+1, n):
dist = distmap[i][j]
pair = Pair([i], [j], dist)
queue.push(pair, dist)
##
deletedCluster = []
while(len(clustersSet) > k):
pair = queue.pop()
if pair.cluster1 in deletedCluster or pair.cluster2 in deletedCluster:
continue
new_cluster = pair.cluster1 + pair.cluster2 ## merge two cluster
clustersSet.remove(pair.cluster1)
clustersSet.remove(pair.cluster2)
deletedCluster.append(pair.cluster1)
deletedCluster.append(pair.cluster2)
for cluster_t in clustersSet:
dist_t = computeMinDist(new_cluster, cluster_t, distmap)
pair_t = Pair(new_cluster, cluster_t, dist_t)
queue.push(pair_t, dist_t)
clustersSet.append(new_cluster)
return clustersSet
1
2
3
clusters1 = HierarchicalCluster(data1, 2)
clusters2 = HierarchicalCluster(data2, 2)
clusters3 = HierarchicalCluster(data3, 2)
1
2
3
4
5
6
7
8
9
10
11
12
13
14
15
16
17
18
19
20
21
22
23
24
25
26
27
28
29
plt.figure(figsize=(14,4))
plt.subplot(131)
plt.grid(True)
colors = cm.rainbow(np.linspace(0, 1, 2))
## Gaunssian
for j in range(2):
points = data1[clusters1[j]]
plt.scatter(points[:, 0].tolist(), points[:,1].tolist(), c=colors[j], label='cls '+str(j))
plt.legend(loc='lower right')
plt.title('Gaussian Data:Hierarchical Clustering')
## Ring
plt.subplot(132)
plt.grid(True)
for j in range(2):
points = data2[clusters2[j]]
plt.scatter(points[:, 0].tolist(), points[:,1].tolist(), c=colors[j], label='cls '+str(j))
plt.legend(loc='lower right')
plt.title('Ring data:Hierarchical Clustering')

## Spiral
plt.subplot(133)
plt.grid(True)
for j in range(2):
points = data3[clusters3[j]]
plt.scatter(points[:, 0].tolist(), points[:,1].tolist(), c=colors[j], label='cls '+str(j))
plt.legend(loc='lower right')
plt.title('Spiral Data: Hierarchical Clustering')

plt.show()

png

Kernel K means

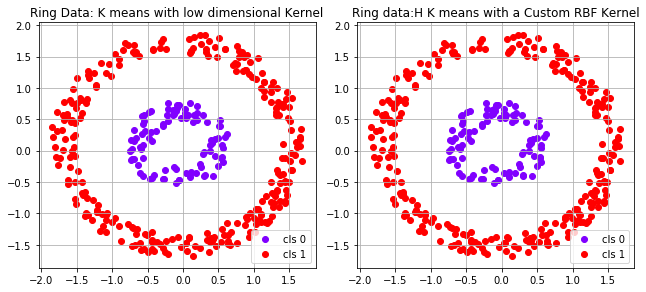
The implementation of K means algorithms with Kernel is shown as the code below. For a valid Kernel, it is an inner product of the data in some Reproducing Kernel Hilbert Space.

The distance of $phi(x_1)$ and $phi(x_2)$ can be defined as $||phi(x_1) - phi(x_2)||^2_2$ using the square of L2 distance.

The center of a cluster $pi_k$is as below, $|pi_k|$ is the number of points in this cluster, $c_k$ is the center of this cluster.

For a point $x_j$, its distance to a cluster center is

From the equations above, we know that we can use K means in a RKHS space without knowing how the data is mapped to that space. Only know the inner product $K(x_i, x_j)$ is enough to implement the Kernel K means algorithms.

1
2
3
4
5
6
7
8
9
10
11
12
13
14
15
16
17
18
19
20
21
22
23
24
25
26
27
28
29
30
31
32
33
34
35
36
37
38
39
40
def KernelKmeans(data, k, epoch, kernel):
n, p = data.shape
c_idx = np.random.choice(n, k, replace=False)
clusters = {}
epoch_count = 10000
GramMatrix = np.zeros((n, n))
## initialization
for i in range(n):
for j in range(i, n):
GramMatrix[i][j] = kernel(data[i], data[j])
GramMatrix[j][i] = GramMatrix[i][j]
for i in range(k):
clusters['cluster_'+str(i)] = []
clusters['cluster_'+str(i)].append(c_idx[i])

diff_sum = 1
while diff_sum > 0.000:
epoch_count -= 1
## use all points in a cluster to update
new_cluster = [[] for i in range(k)]
for i in range(n):
distances = np.zeros(k)
for j in range(k):
## we do not know the center in that high feature space
term1 = GramMatrix[i][i]
points = clusters['cluster_'+str(j)]
size = len(points)
term2 = 2* np.sum(GramMatrix[i][points]) / size
term3 = np.sum(GramMatrix[points, :][:, points])/(size**2)
distances[j] = term1 - term2 + term3
min_idx = np.argmin(distances)
new_cluster[min_idx].append(i)
diff_sum = 0
for j in range(k):
old_cent = np.mean(data[clusters['cluster_'+str(j)]], axis=0)
new_cent = np.mean(data[new_cluster[j]], axis=0)
diff_sum += np.linalg.norm(old_cent - new_cent)
clusters['cluster_'+str(j)] = new_cluster[j]
del new_cluster
return clusters
1
2
3
4
5
6
7
8
9
10
def RBFKernel(point1, point2, sigma=0.4):
return np.exp(-np.linalg.norm(point1-point2)**2 / (2 * (sigma** 2)))
def trivialKernel(point1, point2):
return 2*np.linalg.norm(point1)*np.linalg.norm(point2)
def LinearKernel(point1, point2):
return np.dot(point1, point2)
def polynomialKernel(point1, point2):
return (np.dot(point1, point2))**3
def CustomKernel(point1, point2, sigma=0.4):
return np.exp(-np.linalg.norm(point1**3-point2**3)**2/(2*(sigma**2)))

Ring Data Using Kernel K means

1
2
clusters1 = KernelKmeans(data2, 2, 1000, trivialKernel)
clusters2 = KernelKmeans(data2, 2, 1000, CustomKernel)
1
2
3
4
5
6
7
8
9
10
11
12
13
14
15
16
17
18
19
f, (ax1, ax2) = plt.subplots(1, 2, figsize=(9,4))
plt.tight_layout()

colors = cm.rainbow(np.linspace(0, 1, 2))
ax1.grid(True)
## Trivial Kernel
for j in range(2):
points = data2[clusters2['cluster_'+str(j)]]
ax1.scatter(points[:, 0].tolist(), points[:,1].tolist(), c=colors[j], label='cls '+str(j))
ax1.legend(loc='lower right')
ax1.set_title('Ring Data: K means with low dimensional Kernel')
## Complicated Kernel
ax2.grid(True)
for j in range(2):
points = data2[clusters2['cluster_'+str(j)]]
ax2.scatter(points[:, 0].tolist(), points[:,1].tolist(), c=colors[j], label='cls '+str(j))
ax2.legend(loc='lower right')
ax2.set_title('Ring data:H K means with a Custom RBF Kernel')
plt.show()

png