1
2
3
4
5
6
7
8
9
10
11
12
13
14
15
16
17
18
19
20
21
22
|
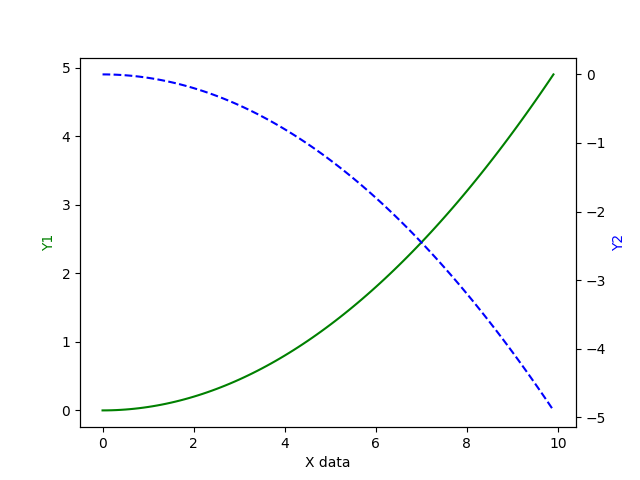
import matplotlib.pyplot as plt
import numpy as np
x = np.arange(0,10,0.1)
y1 = 0.05*x**2
y2 = -1*y1
ax1 = plt.subplot()
ax2 = ax1.twinx()
ax1.plot(x,y1,'g-')
ax2.plot(x,y2,'b--')
ax1.set_xlabel('X data')
ax1.set_ylabel('Y1',color='g')
ax2.set_ylabel('Y2',color='b')
plt.savefig("/home/xuleilx/workspace/github/github_pages/public/images/subaxes.png")
plt.show()
|


近期评论