1
2
3
4
5
6
7
8
9
10
11
12
13
14
15
16
17
18
19
20
21
22
23
24
25
26
27
28
29
30
31
32
|
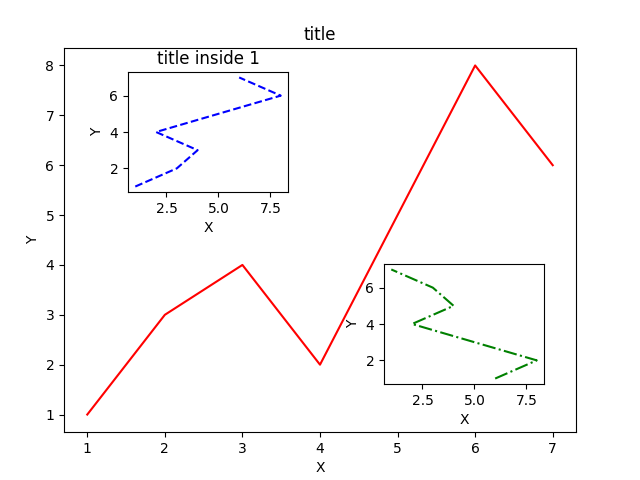
import matplotlib.pyplot as plt
fig = plt.figure()
x = [1,2,3,4,5,6,7]
y = [1,3,4,2,5,8,6]
left,bottom,width,height=0.1,0.1,0.8,0.8
ax1 = fig.add_axes([left,bottom,width,height])
ax1.plot(x,y,'r')
ax1.set_xlabel('X')
ax1.set_ylabel('Y')
ax1.set_title('title')
left,bottom,width,height=0.2,0.6,0.25,0.25
ax2 = fig.add_axes([left,bottom,width,height])
ax2.plot(y,x,'b--')
ax2.set_xlabel('X')
ax2.set_ylabel('Y')
ax2.set_title('title inside 1')
left,bottom,width,height=0.6,0.2,0.25,0.25
plt.axes([left,bottom,width,height])
plt.plot(y[::-1],x,'g-.')
plt.xlabel('X')
plt.ylabel('Y')
plt.savefig("/home/xuleilx/workspace/github/github_pages/public/images/plotinplot.png")
plt.show()
|


近期评论