1
2
3
4
5
6
7
8
9
10
11
12
13
14
15
16
17
18
19
20
21
22
23
24
25
26
27
28
29
30
31
32
33
|
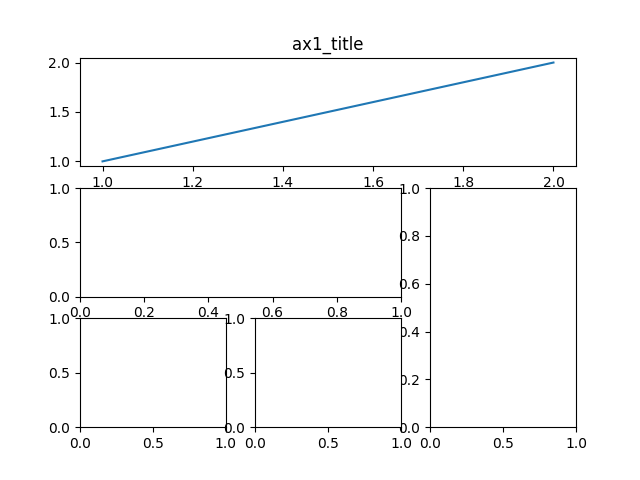
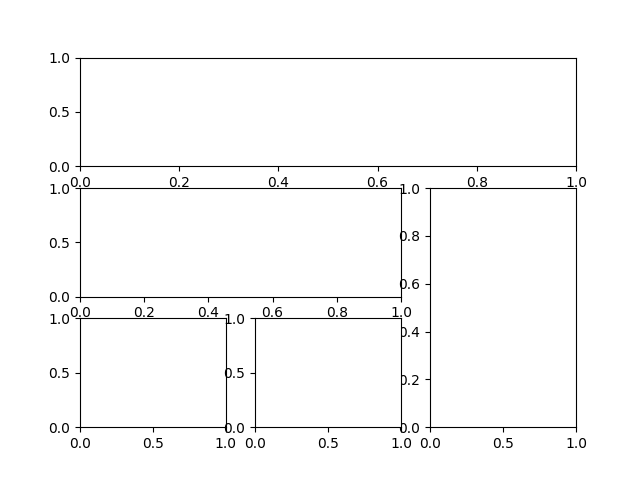
import matplotlib.pyplot as plt
import matplotlib.gridspec as gridspec
plt.figure()
ax1 = plt.subplot2grid((3,3),(0,0),colspan=3,rowspan=1)
ax1.plot([1,2],[1,2])
ax1.set_title('ax1_title')
ax2 = plt.subplot2grid((3,3),(1,0),colspan=2)
ax3 = plt.subplot2grid((3,3),(1,2),rowspan=2)
ax4 = plt.subplot2grid((3,3),(2,0))
ax5 = plt.subplot2grid((3,3),(2,1))
plt.savefig("/home/xuleilx/workspace/github/github_pages/public/images/subplot_method1.png")
plt.tight_layout()
plt.show()
|


近期评论