1
2
3
4
5
6
7
8
9
10
11
12
13
14
15
16
17
18
19
20
21
22
23
24
|
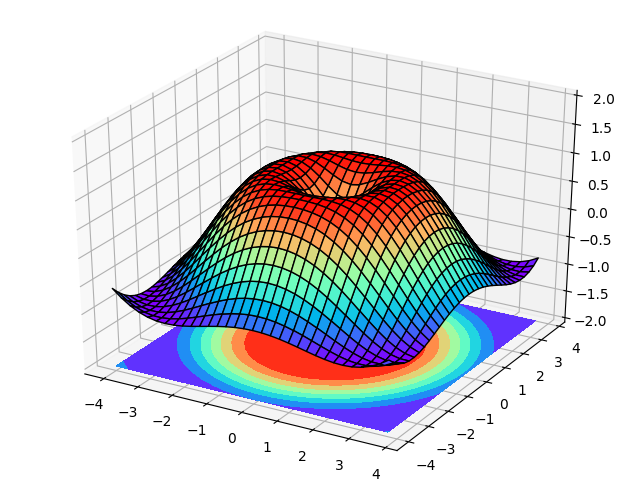
import matplotlib.pyplot as plt
import numpy as np
from mpl_toolkits.mplot3d import Axes3D
fig = plt.figure()
ax = Axes3D(fig)
x = np.arange(-4,4,0.25)
y = np.arange(-4,4,0.25)
X,Y = np.meshgrid(x,y)
R = np.sqrt(X**2+Y**2)
Z = np.sin(R)
ax.plot_surface(X,Y,Z,rstride=1,cstride=1,cmap='rainbow',edgecolor='black')
ax.contourf(X,Y,Z,zdir='z',offset=-2,cmap='rainbow')
ax.set_zlim(-2,2)
plt.savefig("/home/xuleilx/workspace/github/github_pages/public/images/3d_data.png")
plt.show()
|


近期评论