1
2
3
4
5
6
7
8
9
10
11
12
13
14
15
|
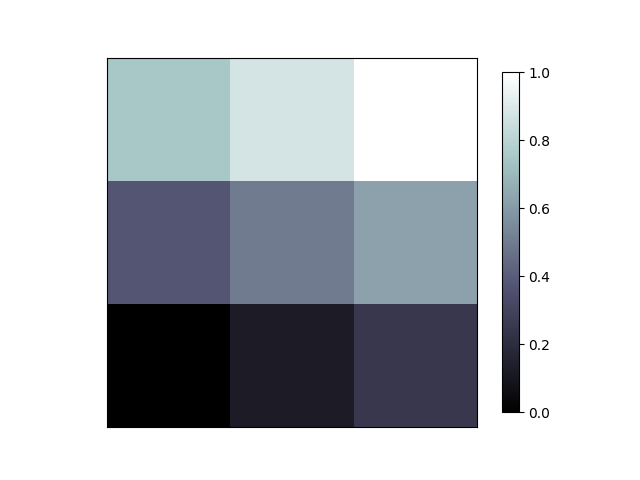
import matplotlib.pyplot as plt
import numpy as np
a = np.linspace(0,1,9).reshape(3,3)
plt.imshow(a,interpolation='nearest',cmap='bone',origin='lower')
plt.colorbar(shrink=.92)
plt.xticks(())
plt.yticks(())
plt.savefig("/home/xuleilx/workspace/github/github_pages/public/images/image.png")
plt.show()
|


近期评论