1
2
3
4
5
6
7
8
9
10
11
12
13
14
15
16
17
18
19
20
21
22
23
24
25
26
27
28
29
|
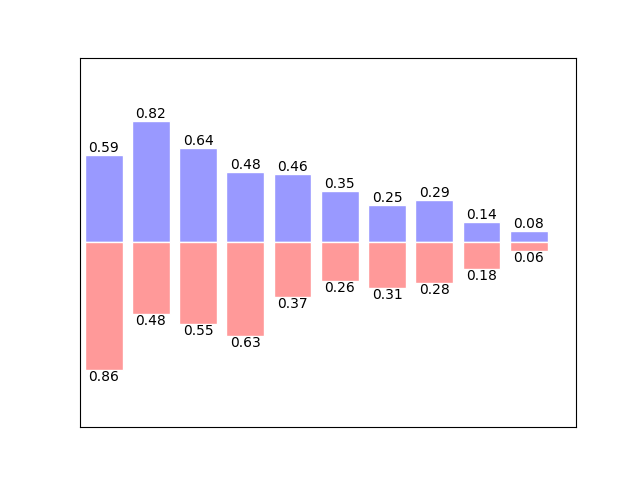
import matplotlib.pyplot as plt
import numpy as np
n = 10
X = np.arange(n)
Y1 = (1-X/float(n))*np.random.uniform(0.5,1,n)
Y2 = (1-X/float(n))*np.random.uniform(0.5,1,n)
plt.bar(X,+Y1,facecolor='#9999ff',edgecolor='white')
plt.bar(X,-Y2,facecolor='#ff9999',edgecolor='white')
for x,y in zip(X,Y1):
plt.text(x,y,'%.2f'%y,ha='center',va='bottom')
for x,y in zip(X,Y2):
plt.text(x,-y,'%.2f'%y,ha='center',va='top')
plt.xlim(-.5,n)
plt.ylim(-1.25,1.25)
plt.xticks(())
plt.yticks(())
plt.savefig("/home/xuleilx/workspace/github/github_pages/public/images/bar_map.png")
plt.show()
|


近期评论