1
2
3
4
5
6
7
8
9
10
11
12
13
14
15
16
17
18
19
20
|
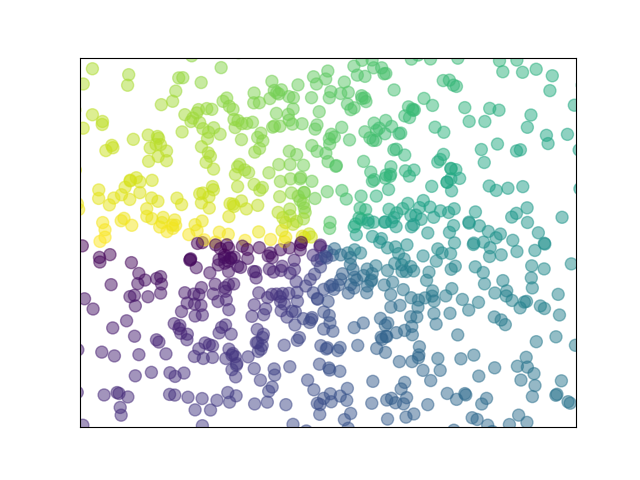
import matplotlib.pyplot as plt
import numpy as np
n = 1024
X = np.random.normal(0,1,n)
Y = np.random.normal(0,1,n)
T = np.arctan2(Y,X)
plt.scatter(X,Y,s=75,c=T,alpha=0.5)
plt.xlim(-1.5,1.5)
plt.ylim(-1.5,1.5)
plt.xticks(())
plt.yticks(())
plt.savefig("/home/xuleilx/workspace/github/github_pages/public/images/dot_map.png")
plt.show()
|


近期评论