1
2
3
4
5
6
7
8
9
10
11
12
13
14
15
16
17
18
19
20
21
22
23
24
25
26
27
28
29
30
31
32
33
34
35
36
37
38
39
|
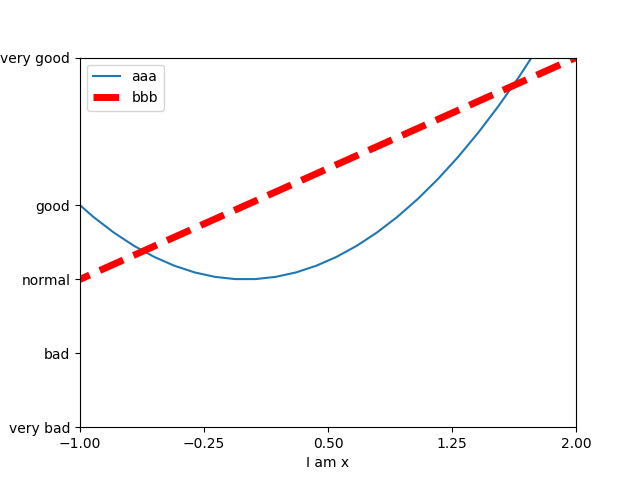
import matplotlib.pyplot as plt
import numpy as np
x = np.linspace(-3,3,50)
y1 = x + 1
y2 = x**2
plt.figure()
plt.xlim(-1,2)
plt.ylim(-2,3)
plt.xlabel('I am x')
plt.ylabel('I am y')
new_ticks= np.linspace(-1,2,5)
plt.xticks(new_ticks)
plt.yticks([-2,-1,0,1,3],
['very bad','bad','normal','good','very good'])
l1, = plt.plot(x,y2,label='up')
l2, = plt.plot(x,y1,color='red',linewidth=5.0,linestyle='--',label='bottom')
plt.legend(handles=[l1,l2],labels=['aaa','bbb'],loc='best')
plt.savefig("/home/xuleilx/workspace/github/github_pages/public/images/legend.png")
plt.show()
|


近期评论