1
2
3
4
5
6
7
8
9
10
11
12
13
14
15
16
17
18
19
20
21
22
23
24
|
# -*- coding: utf-8 -*-
import matplotlib.pyplot as plt
import numpy as np
# 产生数据
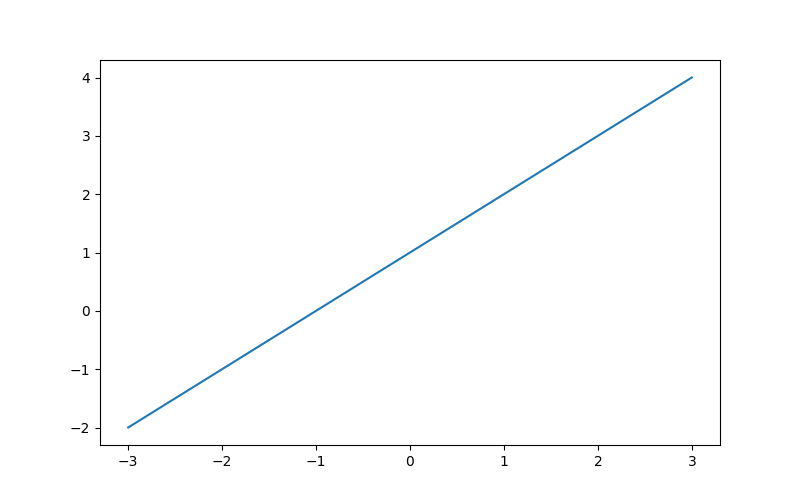
x = np.linspace(-3,3,50)
#绘制直线
y1 = x + 1
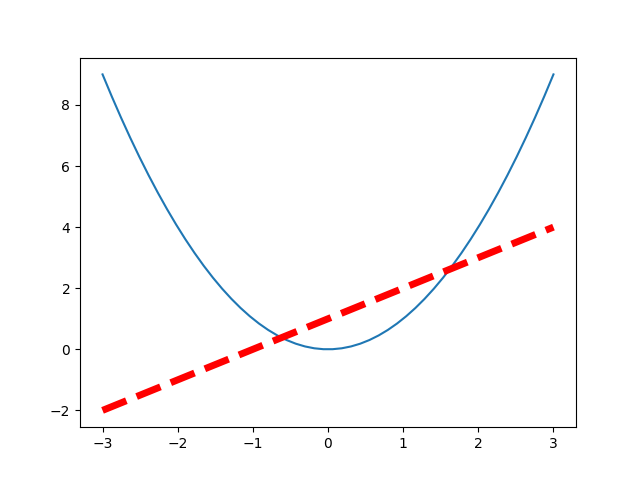
#绘制曲线
y2 = x**2
# figure 3,指定figure的编号并指定figure的大小
plt.figure(num=3,figsize=(8,5))
plt.plot(x,y1)
plt.figure("f2")
plt.plot(x,y2)
# 指定线的颜色, 宽度和类型
plt.plot(x,y1,color='red',linewidth=5.0,linestyle='--')
#显示
plt.show()
|


近期评论