
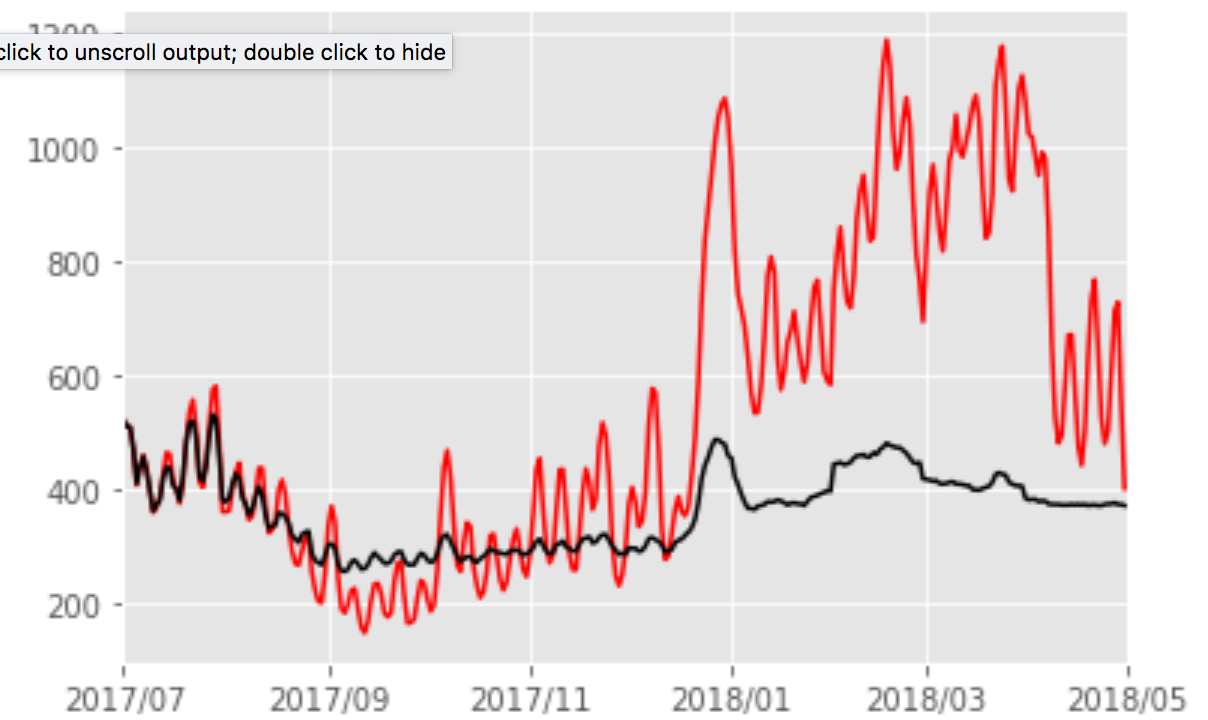
Time series visualization.
- Multiple lines in one plot
- Control what dates printed on x axis;
Things I learned:
Have to use numpy or datetime to transform the date column to datetime type. If use pd.to_datetime() method, somehow matplotlib won’t recognize it;
Code:
import pandas as pd
import numpy as np
import datetime
import matplotlib.pyplot as plt
from matplotlib.dates import YearLocator, MonthLocator, DateFormatter

#  Read in dateframe and convert string to datetime type
test = pd.read_csv("demo_time_series.csv")
test['date'] = test['date'].apply(lambda x: datetime.datetime.strptime(x,'%Y-%m-%d'))

# I have every day but I don't want all of them on x-axis, so re-format them
months = MonthLocator(interval=2)  # Show everyother month
monthFmt = DateFormatter('%Y/%m')
datemin = datetime.datetime.strptime("2018-01", '%Y-%m')
datemax = datetime.datetime.strptime("2018-05", '%Y-%m')

# Define the figure and
fig,ax = plt.subplots()

ax.plot(test['date'],test['real'],color='red')
ax.plot(test['date'],test['pred'], color='black')

# Reformat the x-axis
ax.set_xlim(datemin, datemax)
ax.xaxis.set_major_locator(months)
ax.xaxis.set_major_formatter(monthFmt)
ax.autoscale_view()

plt.savefig('demo_time_series.pdf', format='pdf')
Refrence:
- https://matplotlib.org/gallery/api/date.html
- https://matplotlib.org/api/dates_api.html


近期评论