Matplotlib is a plotting library. In this section give a brief introduction to the matplotlib.pyplot module, which provides a plotting system similar to that of MATLAB.
Plotting
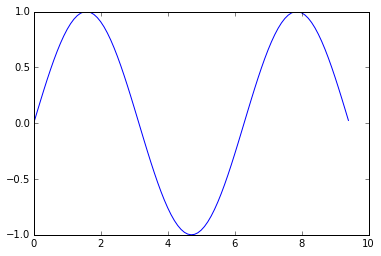
The most important function in matplotlib is plot, which allows you to plot 2D data. Here is a simple example:
1
2
3
4
5
6
7
8
9
10
import numpy as np
import matplotlib.pyplot as plt


x = np.arange(0, 3 * np.pi, 0.1)
y = np.sin(x)

# Plot the points using matplotlib
plt.plot(x, y)
plt.show()  # You must call plt.show() to make graphics appear.
Running this code produces the following plot:
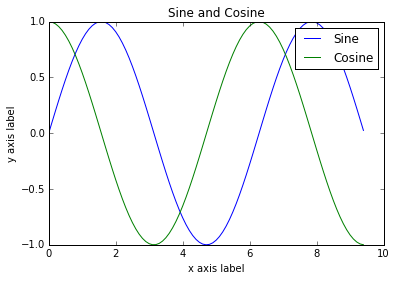
With just a little bit of extra work we can easily plot multiple lines at once, and add a title, legend, and axis labels:
1
2
3
4
5
6
7
8
9
10
11
12
13
14
15
16
import numpy as np
import matplotlib.pyplot as plt

# Compute the x and y coordinates for points on sine and cosine curves
x = np.arange(0, 3 * np.pi, 0.1)
y_sin = np.sin(x)
y_cos = np.cos(x)

# Plot the points using matplotlib
plt.plot(x, y_sin)
plt.plot(x, y_cos)
plt.xlabel('x axis label')
plt.ylabel('y axis label')
plt.title('Sine and Cosine')
plt.legend(['Sine', 'Cosine'])
plt.show()
_More details about plot function in this document._
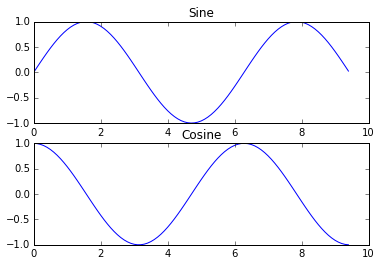
Subplots
You can plot different things in the same figure using the subplot function. Here is an example:
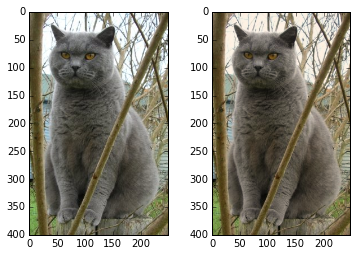
# Show the original image plt.subplot(1, 2, 1) plt.imshow(img)
# Show the tinted image plt.subplot(1, 2, 2)
# A slight gotcha with imshow is that it might give strange results # if presented with data that is not uint8. To work around this, we # explicitly cast the image to uint8 before displaying it. plt.imshow(np.uint8(img_tinted)) plt.show()


近期评论