
Decision tree for classification problems
1. Introduction
Last time we go through regression tree: using decision tree (CART) to tackle regression problem. Another part of CART is classification. To make this blog easier to read, I take binary classification tree as the example, which means we use decision tree to solve binary classification problem.
2. Mathematical Basis
2.1 Comparisons with Regression Tree
To convert regression problem to classification problem, there are several points we need to clarify:
- How to predict the class label of a region? In regression, we use the mean of target in the region (bar{y});
For a certain region (which may include both two classes), we define the class label of the region to be the mode of labels of data points in the region, a.k.a “Majority Vote”.
- How to measure the performance of one split, or say which loss function to use? In regression, we use squared loss function;
Based on our definition of region label assignment, the error is the proportion of data points in that region that don’t belong to the class that region label indicates, it is misclassification rate, the misclassification rate produced by one split is
[
L = sum^{2}_{r=1}p_{r}sum_{x_{i}in R_{r}}mathbb{I}{y_{i}neq hat{y}_{r}}
]
where (hat{y}_{r}) is the mode of observation labels in region (r), (p_{r}) is the proportion of observation in the region to the total sample size. This is also know as 0-1 loss.
2.2 Measures of Node Impurity
However this measure for error is not sufficiently sensitive for tree-growing (mentioned in page 315, Introduction to statistical learning). In practice, two other measures are used:
- Gini index:
[
L = sum^{2}_{r=1}p_{r}sum^{1}_{k=0}p_{rk}(1-p_{rk}).
]
Motivation for Gini index: instead of predicting the most likely class, it predict the probability for each class. Gini index is the expected misclassification rate.
- Information gain
[
L = -sum^{2}_{r=1}p_{r}sum^{1}_{k=0}p_{rk}log(p_{rk}).
]
where (p_{rk}) is the proportion of class (k) in region (r). Note its difference with cross entropy.
We can plot them together (assume there are two regions and they are equal sized).
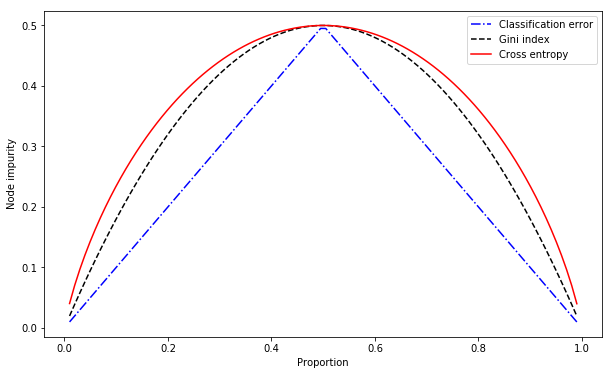
When the region is mostly one category, Gini index and cross entropy will take a smaller value (which means node impurity is higher, as shown in the plot), they are better measures of the node purity.
2.3 Loss Function
As mentioned above, Gini index and cross entropy could be used as measure for tree node impurity. And they can also regarded as loss functions for classification tree. Specifically, CART uses Gini index; ID3, C4.5 use information gain. They are supposed to produce different trees, also notice that in sklearn.tree.DecisionTreeClassifier, there is a parameter criterion with options gini and entropy.
3. Implementation
Since we already implemented regression tree before, we just need to update the loss function and prediction function. Here is the source code and demo
|
|
4. References
- Gareth James, Daniela Witten, Trevor Hastie, Robert Tishirani, Introduction to Statistical Learning.
- Decision Tree Learning, https://en.wikipedia.org/wiki/Decision_tree_learning


近期评论