
Forecasting the Flow of Human Crowds
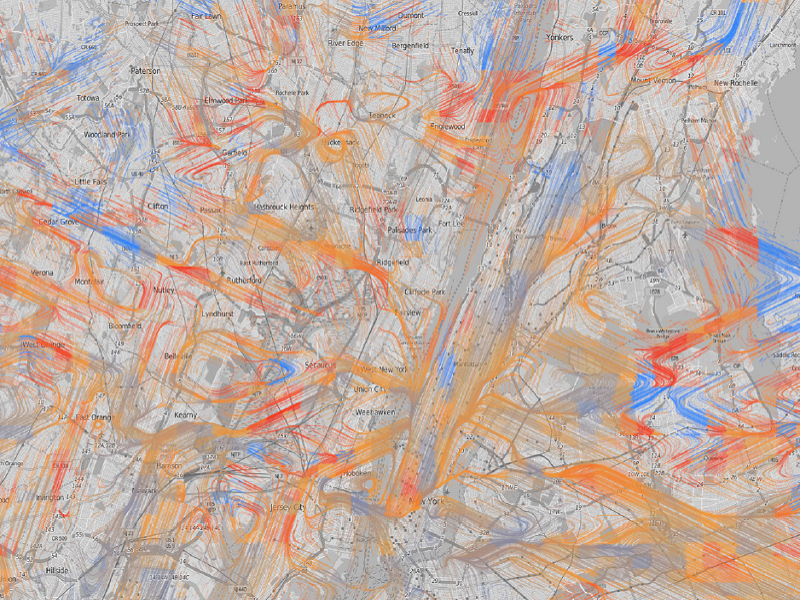
We introduce a space-based approach to forecasting the overall flow of human crowds. Given a space with a large number of moving individuals, our model partitions the space into smaller sub-spaces, and then summarizes the flows for each sub-space. We apply seasonal trend analysis in each sub-space to forecast the future level of crowd movement based on the observed historical time series flow patterns, then combine the predicted results to visualize the overall future flow. Our methodology is comprised of directional flow density estimation for preserving original paths and movement directions, and a novel flow smoothing method utilizing local and global trends to mitigate data sparsity and noise. We present results from a series of statistical tests across different spatial movement datasets (e.g., location-based social network, GPS tracks of humans and taxis). (IEEE TVCG: under review)
Multi-Scale Spatial Data Clustering and Visualization
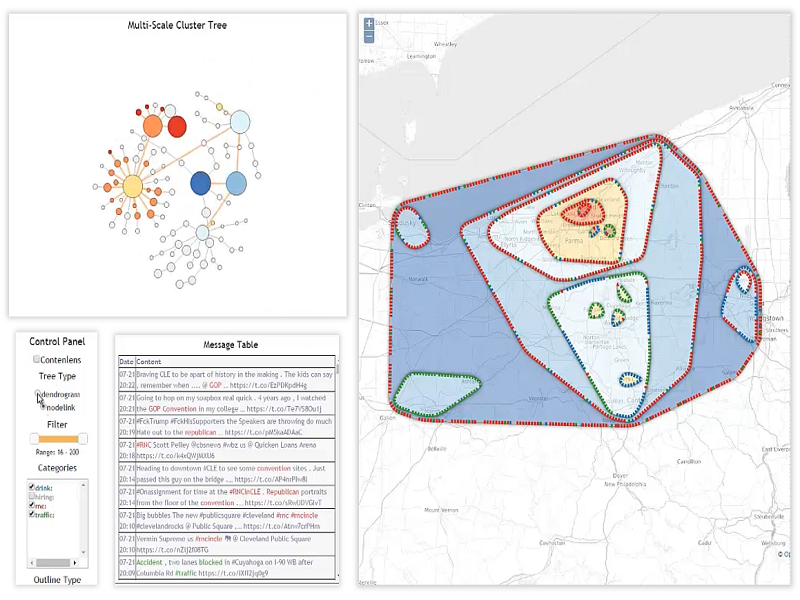
Spatial datasets often exhibit different distribution patterns at multiple levels of scale, such as live updates about events occurring in very specific locations on the map. Navigating in such multi-scale data-rich spaces is often inefficient, requires users to choose between overview or detail information, and does not support identifying spatial patterns at varying scales. We propose TopoGroups, a novel context-preserving technique that aggregates spatial data into hierarchical clusters to improve exploration and navigation at multiple spatial scales. The technique uses a boundary distortion algorithm to minimize the visual clutter caused by overlapping aggregates. Our user study explores multiple visual encoding strategies for TopoGroups including color, transparency, shading, and shapes in order to convey the hierarchical and statistical information of the geographical aggregates at different scales.
[PDF] [Video]
Real-Time Location-Based Social Media Visual Analytics
Also known as Social Media Analytical and Reporting Toolkit (SMART)
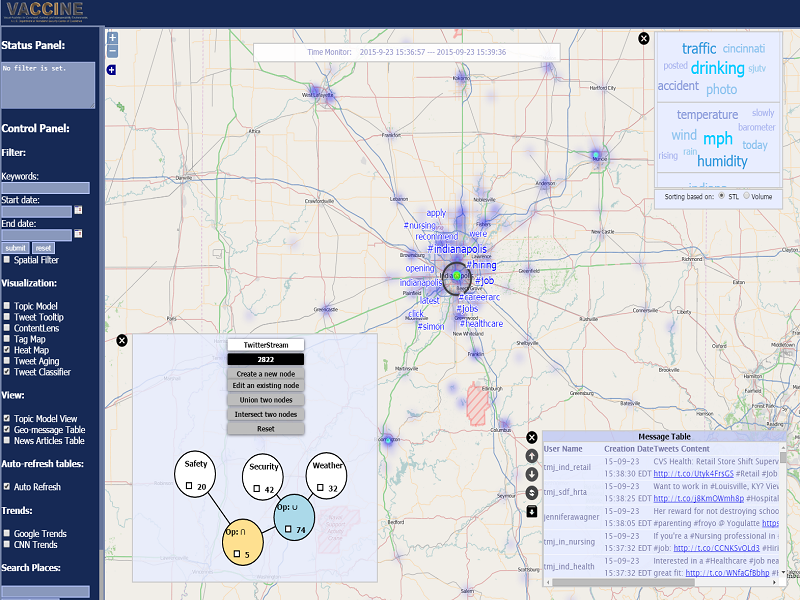
The number of microblog posts published daily has reached a level that hampers the effective retrieval of relevant messages and information, while the volume of data from services such as Twitter is still increasing. Analysts require new methods for monitoring topics of interest, identifying trends and anomalies, and dealing with the data volume and its dynamic nature. It is of particular importance to provide situational awareness for decision making in time-critical tasks. SMART provides end users with scalable and interactive social media analysis and visualization through topic extraction, combination of filters, cluster examination, and stream categorization. These components are tightly integrated into a highly interactive visual analysis workbench, which allows end users to observe, supervise, and configure the methods in each individual analysis process.
[Poster] [Video1] [Video2] [Video3]
Visual Analytics of Multiple Scales and Information Dimensions in Social Media
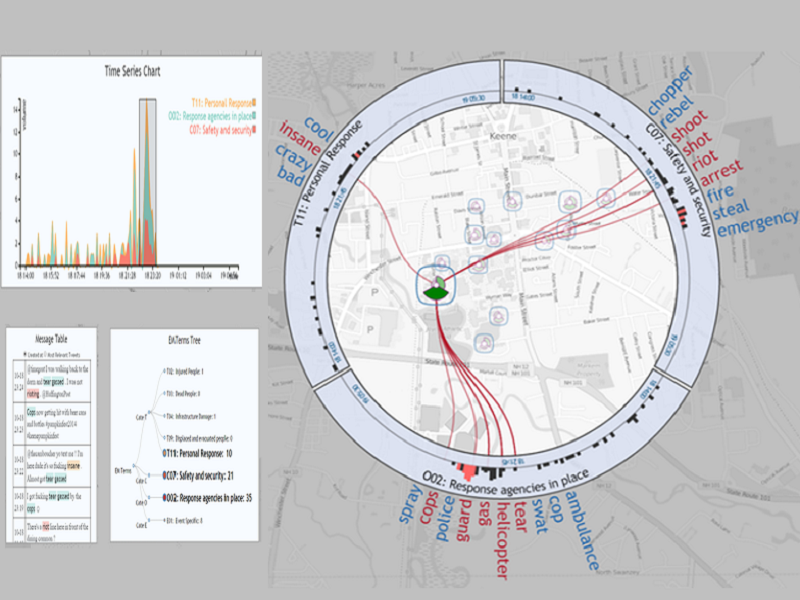
Real-time microblogs can be utilized to provide situational awareness during emergency and disaster events. However, the utilization of these datasets requires the decision makers to perform their exploration across a range of data scales from local to global, while maintaining a cohesive thematic context of the transition between different granularity levels. The exploration of different information dimensions at the varied scales remains to be a non-trivial task. We present a visual analytics situational awareness environment that supports the real-time exploration of microblog data across multiple scales of analysis. We classify microblogs based on a fine-grained, crisis-related categorization approach, and visualize the spatiotemporal evolution of multiple categories by coupling a spatial lens with a glyph-based visual design. We propose a transparency-based spatial context preserving technique that maintains a smooth transition between different spatial scales.
[PDF] [Video] [Slides]
Interactive Identification of Key Players in Social Conversations on Special Events
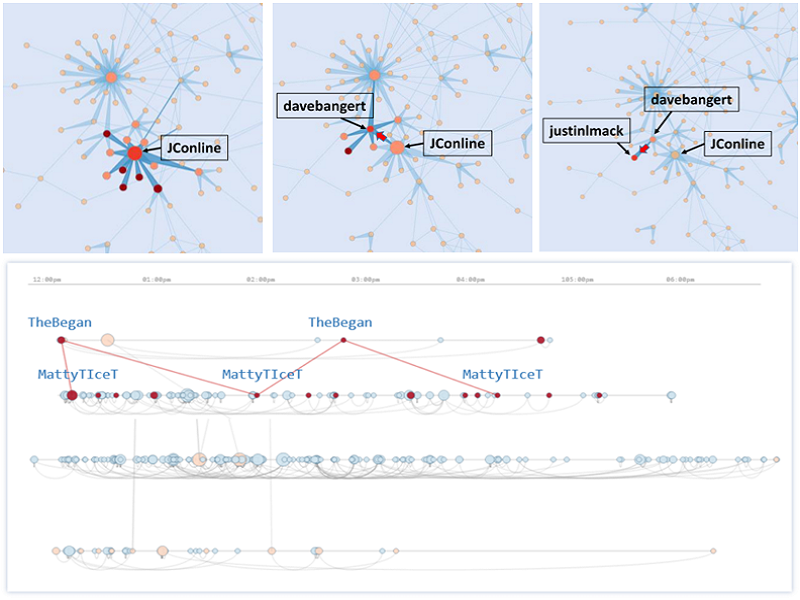
Social networks have evolved as an important source of information and situational awareness in crisis and emergency management. With a massive number of messages generated and diffused through social networks, influential users in social networks are often instrumental in providing important information and serve as vital links for other sources. In this paper, we propose a visual analytics system focusing on identifying key players in dynamic social networks using Twitter data. The networks are generated based on the similarity metric of users’ topics, their retweet/reply relationships, and are then visualized using node-link as well as timeline representation. The system provides highly interactive filtering and editing operations of the networks to help categorize different topics, detect influential users in specific events, and investigate the underlying patterns over time.


近期评论