
Delgado-Baquerizo, M., and Coauthors, 2013: Decoupling of soil nutrient cycles as a function of aridity in global drylands. Nature, 502, 672-676. doi:10.1038/nature12670
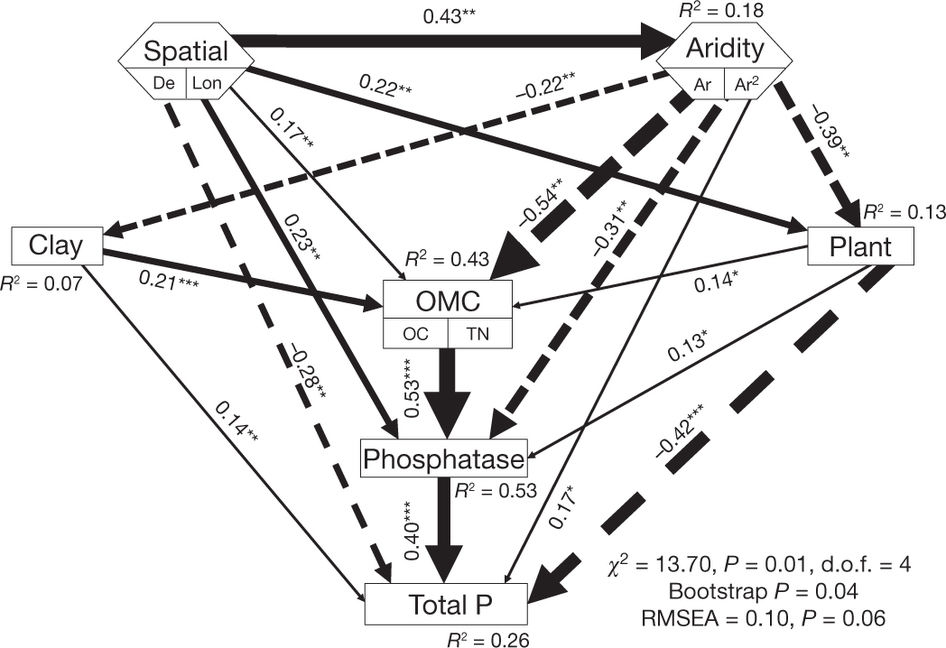
Fig.2 Effects of aridity, clay percentage, plant cover and site position on the organic matter component, total-P concentration and phosphatase activity. Spatial coordinates of the study sites are expressed in terms of distance from Equator (De) and longitude (Lon). Numbers adjacent to arrows are standardized path coefficients, analogous to relative regression weights, and indicative of the effect size of the relationship. Continuous and dashed arrows indicate positive and negative relationships, respectively. Arrow width is proportional to the strength of the relationship. The proportion of variance explained (R2) appears alongside every response variable in the model. Goodness-of-fit statistics for each model are shown in the lower right corner (d.o.f., degrees of freedom; RMSEA, root mean squared error of approximation). There are some differences between the a-priori model and the final model structures, owing to removal of paths with coefficients close to zero (see the a-priori model in Extended Data Fig. 4). Hexagons are composite variables30. Squares are observable variables. The organic matter component (OMC) is the first component from a PCA conducted with soil organic carbon (OC) and total nitrogen (TN). P < 0.05, **P < 0.01, **P < 0.001.
Our model explained 43%, 26% and 53% of the variance in the organic matter component (first component from a principal-component analysis (PCA) conducted with organic C and total N), total P and phosphatase activity, respectively. Aridity had a direct negative effect on the organic matter component and phosphatase activity, but a positive effect on total P (Fig.2).
Overall, SEM has emerged as a synthesis of path analysis, factor analysis and maximum-likelihood techniques, and has been thoroughly used in the ecological sciences as a causal inference tool. It can test the plausibility of a causal model, which is based on a-priori information on the relationships among the particular variables of interest.
Another important capability of SEM is its ability to partition direct and indirect effects that one variable may have on another, and estimate the strengths of these multiple effects. Unlike regression or analysis of variance, SEM offers the ability to separate multiple pathways of influence and view them as a system. Thus, SEM is useful for investigating the complex networks of relationships found in natural ecosystems.
All the SEM analyses were conducted using AMOS 18.0 (Amos Development Co.). The remaining statistical analyses were performed using SPSS 15.0 (SPSS Inc.).


近期评论